Timber Lakes Weather
This website displays Timber Lakes weather data only.
You can return (or go) to the official Timber Lakes Property Owners website by clicking on the Go to TLPOA tab above.
Caution
The weather data on this site is generated as a hobby from a personal weather station located on the upper mountain on the east side of Timber Lakes. No one should rely on the accuracy of the data or the forecast.
Reload This Page
Because your browser is caching some weather data on this page (i.e. saving old data to allow the page to load faster), you may need to force your browser to bypass the cache and load the data fresh from the server. To force your browser to load the most recent weather data, click on the Reload This Page button below.
If reloading the page does not update some of the weather information, you need to clear the cache in your browser. Usually just clearing the last hour will suffice.
If you are using Google Chrome, in addition to Google tracking every single website you have visited since Al Gore invented the Internet, you might have to clear your browser cache every time you view the page. Ain’t technology grand?
Conditions
Conditions are updated approximately every five minutes. You have to press the Reload This Page button above to refresh conditions.
Current Weather
The weather gauges are updated every 30 seconds.
Hover your mouse over a gauge, or tap the gauge on your smartphone, to see a graph of weather data since midnight. A second tap on your smartphone will close the graph.
For more information about these gauges and what they display ==> click here.
Today
| Sunrise | |
| Sunset | |
| Daylight Amount (Hours:Minutes) | |
| Sunshine Amount (Hours to 2 decimal places) | |
| Where is the Sun? |
This is a graphical representation of the Sun’s current position relative to Timber Lakes — script courtesy of Mark Crossley’s kindness. |
| Moon Phase |
|
| Tonight’s Weather Forecast | Dark. Continued dark overnight, with widely scattered light by morning. The weather will continue to change for a long, long time. (George Carlin, 1937-2008) |
| Today’s Weather Fact | |
| Weather Station Software Uptime (Days:Hours:Minutes) |

Radar
Forecast
The National Weather Service (NWS) provides a Timber Lakes forecast. Click here for the Timber Lakes Forecast.
The Salt Lake City NWS Office also maintains an excellent website displaying weather watches, warnings, advisories, maps, and other information about various Utah weather-related items. Click here for the SLC NWS Wesbite.
The NWS forecast maps for the next three days:
Today’s Forecast Map
Tomorrow’s Forecast Map
Day 3’s Forecast Map
Lightning Strikes
One-month Precipitation Forecast

Heat Risk
The National Weather Service HeatRisk Prototype is a color-numeric-based index that provides a forecast risk of heat-related impacts to occur over a 24-hour period. You can view today’s Heat Risk map for the Western US by clicking here.
You can also view today’s Heat Risk map for the Timber Lakes area by clicking here.
Wind Forecast
The Timber Lakes area wind forecast is provided by Windy.com and is based on the the European Centre for Medium-Range Weather Forecasts (ECMWF). ECMWF is an independent intergovernmental organization supported by 34 European countries. Studies show the ECMWF wind forecasts are consistently more accurate than those projected by the National Weather Service. The forecast is for surface wind, which is measured at 30 feet above the surface of the ground. You can either drag the timeline bar along the bottom or click on the play icon to see how the wind forecast varies over the next 3 days.
Air Quality
The The World Air Quality Index (WAQI) maps air pollution data from more than 250,000 air quality monitoring stations around the world. The data published by WAQI is real-time and therefore unvalidated at the time of publication. However, data consistency is verified, in real-time, with neighbor stations, allowing automatic detection and removal of defective monitoring stations, if needed, from the map. To view current air quality from the stations in closest proximity to Timber Lakes, click here for the WAQI website map.
This Month and Last
Wildfire Outlook
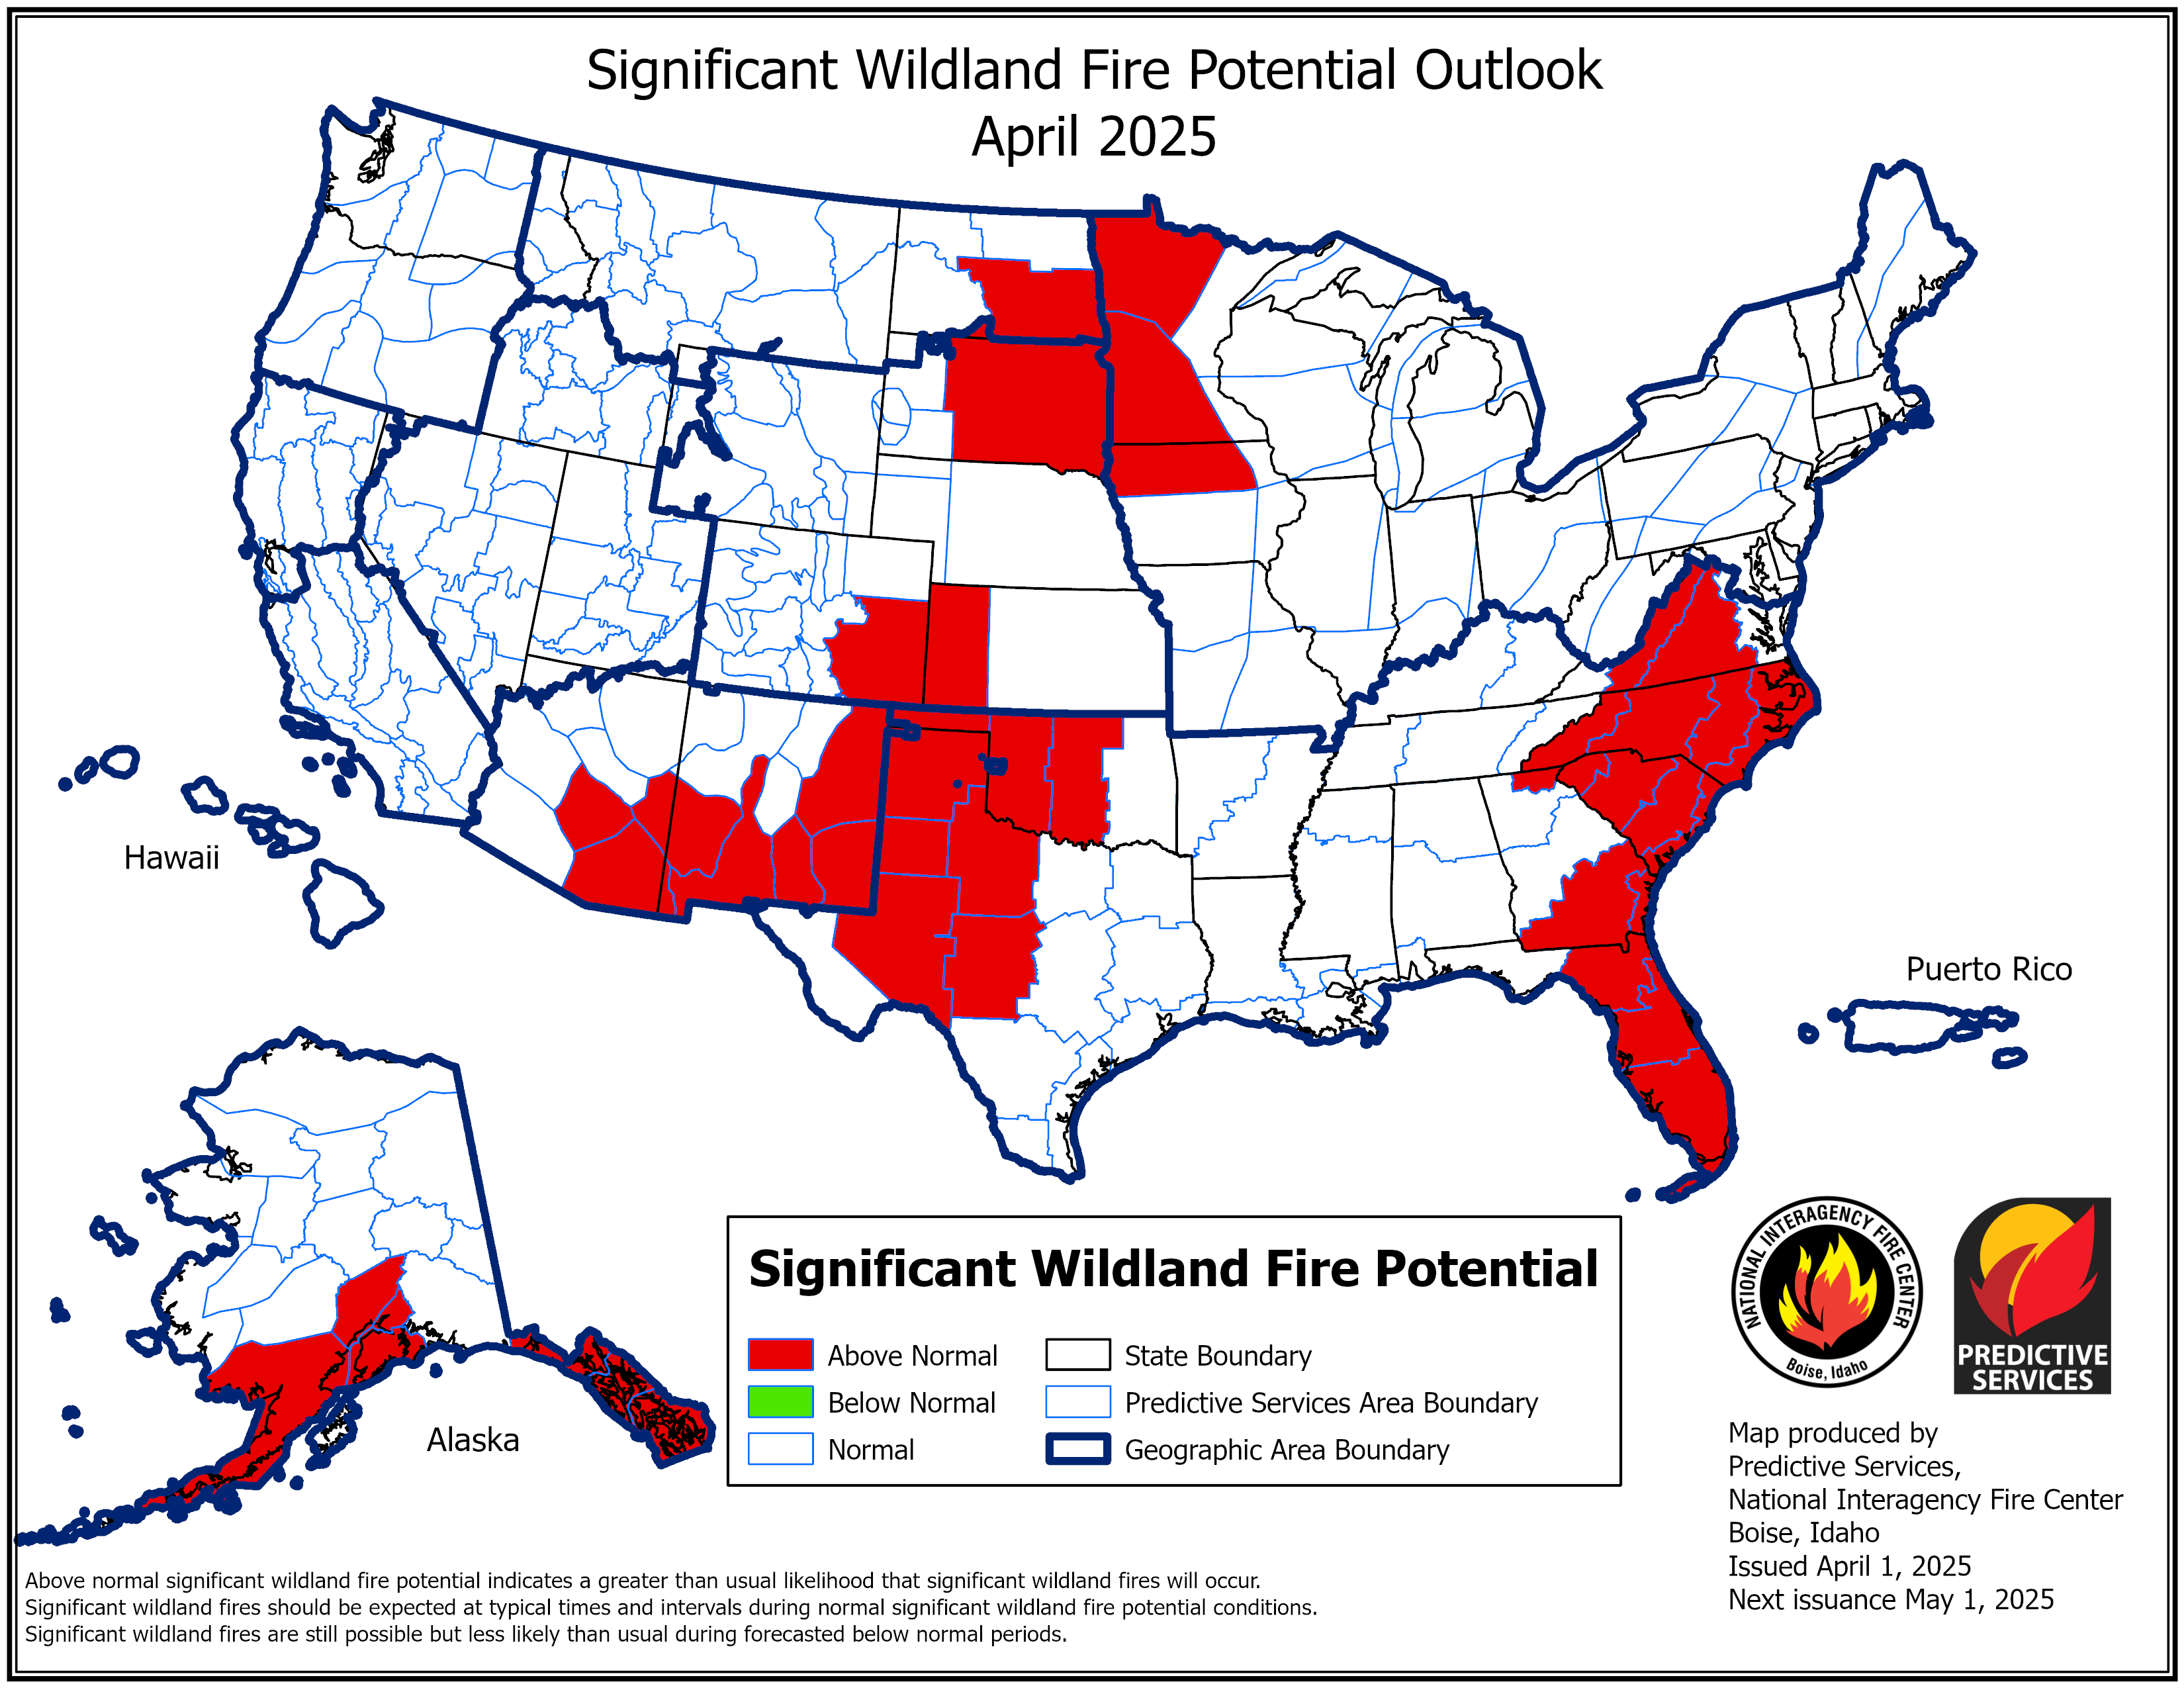
The National Interagency Fire Center (NIFC) is the focal point for overseeing all wildfire interagency coordination activities throughout the United States. Wildfire suppression is built on a three-tiered system of support – the local area, one of the 10 geographic areas, and finally, the national level. When a fire is reported, the local agency and its firefighting partners respond. If the fire continues to grow, the agency can ask for help from its geographic area. When a geographic area has exhausted all its resources, it can turn to National Interagency Coordination Center for help in locating what is needed, from air tankers to radios to firefighting crews to incident management teams. The following map is the Center’s most recent one-month outlook of potential wildfire areas compared to normal conditions.
Significant Wildfire Potential
NIFC also maintains a National 7-day Significant Fire Potential map. You can see the most recent wildfire potential map for our area by clicking here. Hover your mouse over the legend (or tap the legend on your smartphone) on the linked map for more detail.
Water – or Lack Thereof
According to the U.S. Drought Monitor, Timber Lakes (and the surrounding area) experienced a significant drought for several years. Our area is currently classified as being Abnormally Dry1. This is the final stage before drought conditions result. According to the PRISM Climate Group, the 30-year average annual rainfall for our area is 28.98 inches.2 Our rainfall for the most recent water year (ending September 30, 2023)3 was 43.33 inches,4 the highest amount ever recorded at this weather station. Currently, approximately 31% of the state is in abnormally dry or moderate drought condition. Thank you for conserving potable water.
Please note that per the U.S. Geological Survey, the water year begins on October 1, not January 1.

The annual water-year precipitation recorded in Timber Lakes during the past several years demonstrates how far below the 30-year average we are.
This teacup diagram depicts the current status of the reservoirs along the Wasatch Front, including the Bear River Basin, Weber River Basin, and Provo River Basin.5

Northern Utah Reservoir Levels – 2024 Water Year
Information displayed in RED simply means the data for that lake is not as current as the readings for the lakes depicted in BLUE.
Notes:
1 The U.S. Drought Monitor is produced through a partnership between the National Drought Mitigation Center at the University of Nebraska-Lincoln, the United States Department of Agriculture, and the National Oceanic and Atmospheric Administration and is updated weekly.
2 The PRISM Climate Group at Oregon State University gathers climate observations from a wide range of monitoring networks, applies sophisticated quality control measures, and develops datasets to reveal short- and long-term climate patterns, covering the period from 1895 to the present. At the end of each decade, the average values of temperature and precipitation variables are computed over the preceding 30 years. The current set of 30-year annual normals covers the period 1991-2020. The 30-year-average for our area was retrieved from PRISM through CoCoRaHS on December 2, 2021.
3 As defined by the U.S. Geological Survey, the water year runs from October 1 through September 30.
4 The actual rainfall was measured at one location in Timber Lakes and may not represent every location; your mileage may vary. The water content of snow is measured by melting the snow collected in the rain gauge.
5 Lake and reservoir data provided by the Upper Colorado Region of the Bureau of Reclamation, Department of the Interior. By comparison, Flaming Gorge, in the Uintah Basin, is 88% full and Lake Powell, in southeastern Utah, is 42% full. Locally, Strawberry is 99% full, Currant Creek is at 99%, and Starvation is at 92%.
Once a month, the US Climate Prediction Center forecasts drought conditions for the following three months. Here is the most recent prediction.
Seasonal Drought Prediction
Precipitation
The Natural Resources Conservation Service, a department of the United States Department of Agriculture, collects data on Utah’s precipitation. To view their map depicting the amount of precipitation we have received YTD for the water year (starting Oct 1) compared to normal (the median of the previous 20 years) click on this link.